In the coming weeks our Green Creative Cluster (a group of staff and volunteers working to minimise GWL’s impact on the environment) are introducing some of its work in a series of blog posts. Today, Becca and Emily talk about stats.
Hello everyone! Following on from Doreen and Mary’s beautiful blog about our garden, we wanted to talk about another aspect of our Green Cluster work: monitoring and analysing data. It certainly isn’t glamorous. It isn’t as bright and cheerful as our small garden growing in Springtime, and it isn’t as delicate as the pretty teacups we use instead of disposable cups, but it is extremely useful. It’s mostly numbers, head-scratching and playing on excel! But this is how we understand our current carbon emissions, our waste, and what we can do about it. Not only is this necessary for our funding reports, it helps us develop strategies to reduce our emissions, and to make informed decisions about utilities management and building priorities.
At this moment in time, when we’re feeling a bit homesick from not working in our beautiful listed building, we wanted to celebrate this often hidden side to our environmental work and gather together some graphs to share with you.
Hopefully this will give you an insight into some of the behind-the-scenes Green work at GWL!
Disclaimer: Becca and Emily both love stats so this feels kind of glamorous to us….
This piechart shows our Carbon Emissions for 2018/2019.
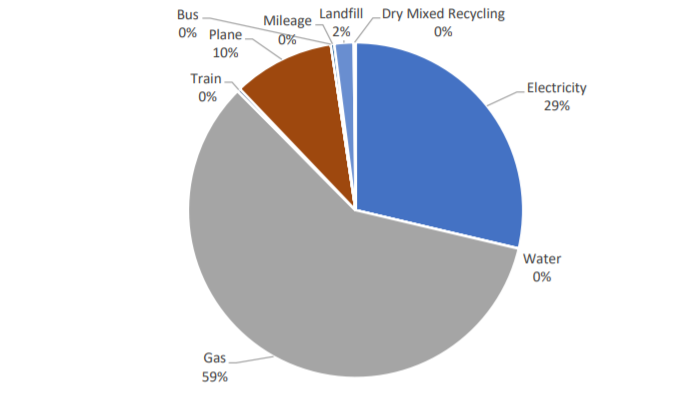
Monitoring emissions is the first step towards reducing them. Now that we know where our emissions come from we can focus our efforts on reducing them in line with national targets of reducing our emissions by around 7% year on year. (which follows from the 2019 amendment to the Scottish Climate Change Act commits Scotland to a 75% reduction in emissions by 2030, with zero carbon to be reached by 2045.)
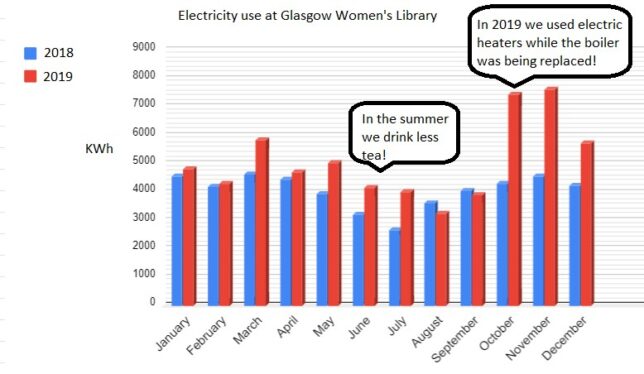
As you can see from this pie chart, our highest emissions come from our gas use. We have recently replaced our ancient gas boiler and so we’re very excited to see how this effects our emissions going forward. We’re also working on getting funding for secondary glazing of our windows so we lose less heat through our large windows.
For 2018/2019, our organisation’s 2018-19 Carbon Footprint was 49 tonnes CO2e.
For reference, the average annual carbon footprint of a person living in the UK is 10 tonnes CO2e.
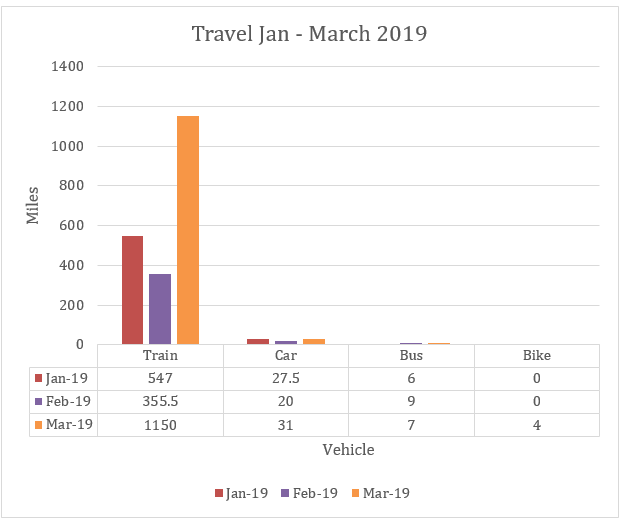
We record our travel for work (not to and from work) every January to March. This includes school visits, talks, community events, research visits and all our outreach work.
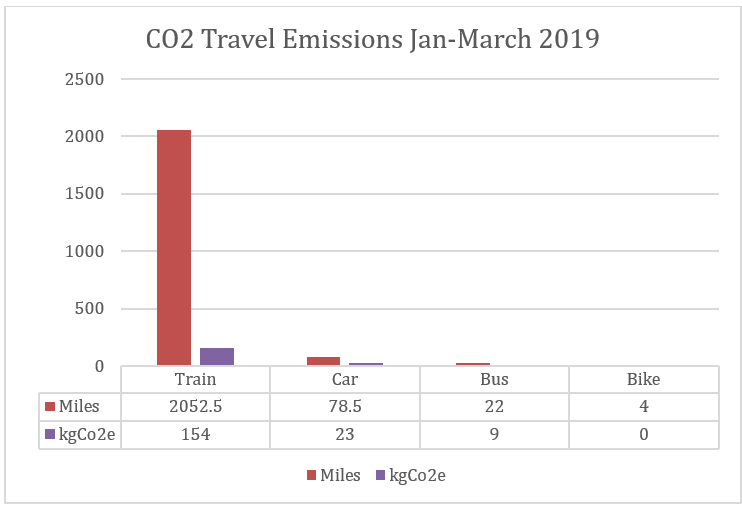
We are an organisation committed to outreach work, and we deliver events, conferences, workshops and exhibitions across Scotland and further afield. By choosing to travel by train more often than car we are reducing our carbon emissions. We also commit to developing digital events, such as this years Open the Door festival and we live-stream some events that take place at GWL.
Comments are closed.