An update on our ongoing project Towards a Green Library, and the steps we’re taking to get our building closer to operational net zero.
As the seemingly never-ending winter marches on, the need for insulating our building is often felt by our staff, volunteers and visitors alike. Some of our spaces take a long time to warm up and lose the heat very quickly as soon as the boiler is turned off – while other spaces tend to overheat in the afternoons when the heating has been on for a few hours. To make our space more comfortable and to reduce our use of fossil fuels we’re working on the first phase of our net zero plan which entails insulating the building from all sides (including the basement and the loft!) You can read our previous blog post to learn more about the project.
While we’ve been waiting to get the insulation works started, we’ve been busy setting up temperature monitoring at the library and gathering data. We wanted to find out more about how our boiler usage and the weather outside affect the different spaces in the library. We wanted to also establish a baseline so that once the insulation is installed we can compare the results and have tangible data to show what the insulation does to the building’s thermal performance. We’re especially interested in recording heat loss and how fast it happens in the different spaces depending on windows and proximity to the external walls.
I’ve been working with one of our brilliant volunteers, Kirsty, who works as an environmental and sustainability consultant for buildings in use. She came to our Net Zero Handbook Launch event in the summer of 2023, and it was the first time she visited the library! She wanted offer her expertise and volunteer with us – and her work has been invaluable.
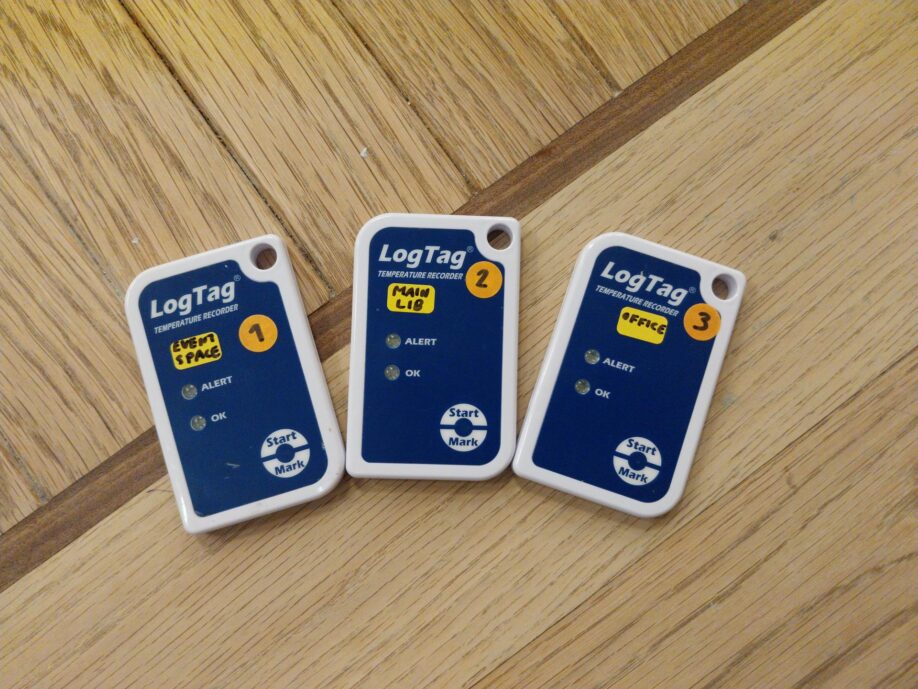
To start off in February 2024 we set up Logtag temperature recorders in the five different main spaces of the library – they were easy to set up and came with a computer programme for downloading and analysing the results. The recorders take a temperature reading each hour, and once a month we download the data, after which the more complicated stage of the work begins… We also take note of when the boiler is on, and find daily high and low outside temperatures for each day online. Kirsty has taken on the mammoth task of wrangling this data and finding ways to present it in an effective way with graphs over different periods of time. Her work has been irreplaceable as spreadsheets filled with numbers tend to make my head spin…
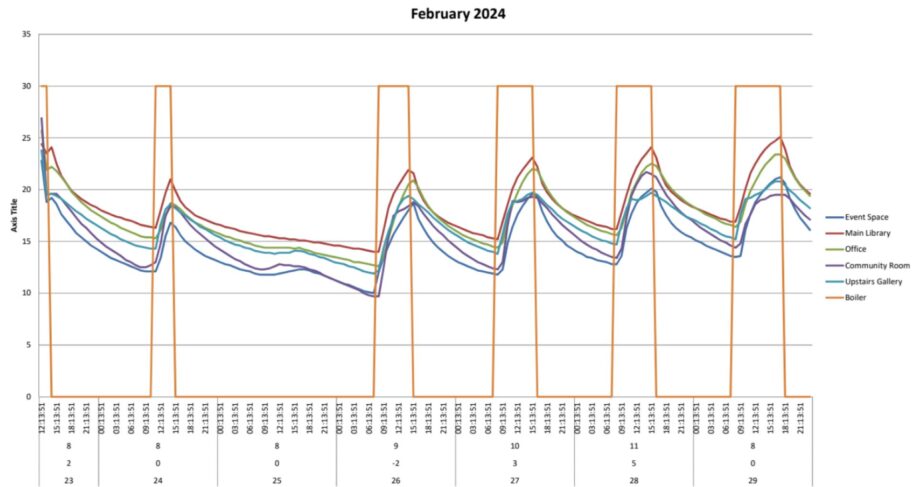
What we’ve found so far has been close to what we expected and already knew from our experience of using the building throughout different seasons. The main library space is surrounded by other rooms and has no external windows – that’s where the temperature stays the most even but it can easily overheat in the afternoons when the heating has been on for hours. Our staff office is often quite a bit colder, and staff and volunteers sometimes have to resort to using blankets and hot water bottles on the coldest days!
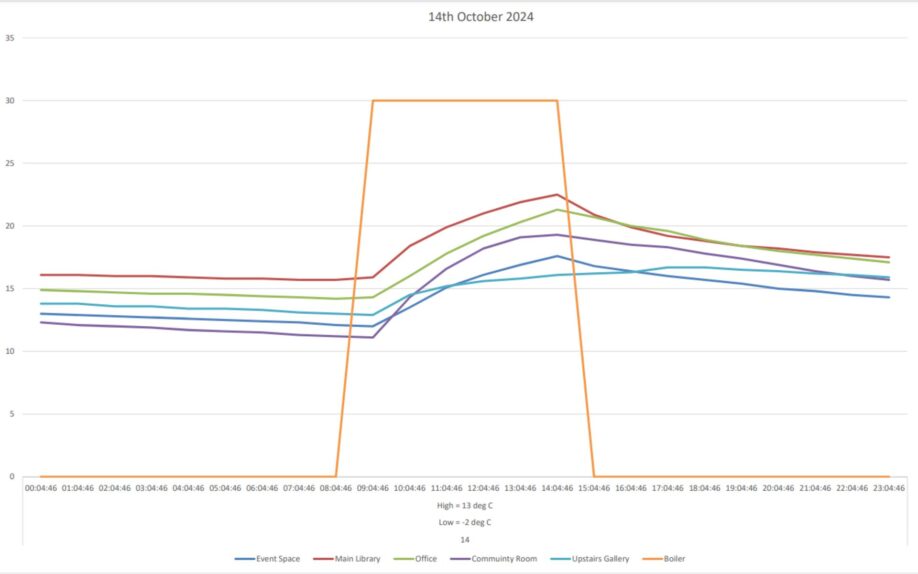
Our Event Space has very high ceilings and huge windows, and the temperature fluctuates quite dramatically in the space thanks to being surrounded by external walls on three sides. The temperature slowly climbs upwards while the heating is on, and drops back down very quickly once it’s turned off. This is something we want to reduce by installing insulation – as heat will be retained longer, we’ll be able to reduce our usage of the gas boiler and have a more comfortable space.
A later phase of the net zero is all about improving our heating controls so that we can better adjust the temperature in the individual spaces as well. Currently only our Community Room and Gallery have adjustable radiators which allow us to fine-tune the temperature with more immediate results.
Watch this space for more updates as we improve our building systems to reduce our carbon footprint!